GAEA WinFence v2.30
http://forum.civilea.com/showthread.php?tid=21673
* Geotechnical Software *
- Easily create detailed cross-sections and fence diagrams -
Size: 44.66 MB
 |
| بند انگشتی, برای دیدن عکس به صورت کامل بر روی آن کلیک نمایید |
Cross-Section Extension Module:
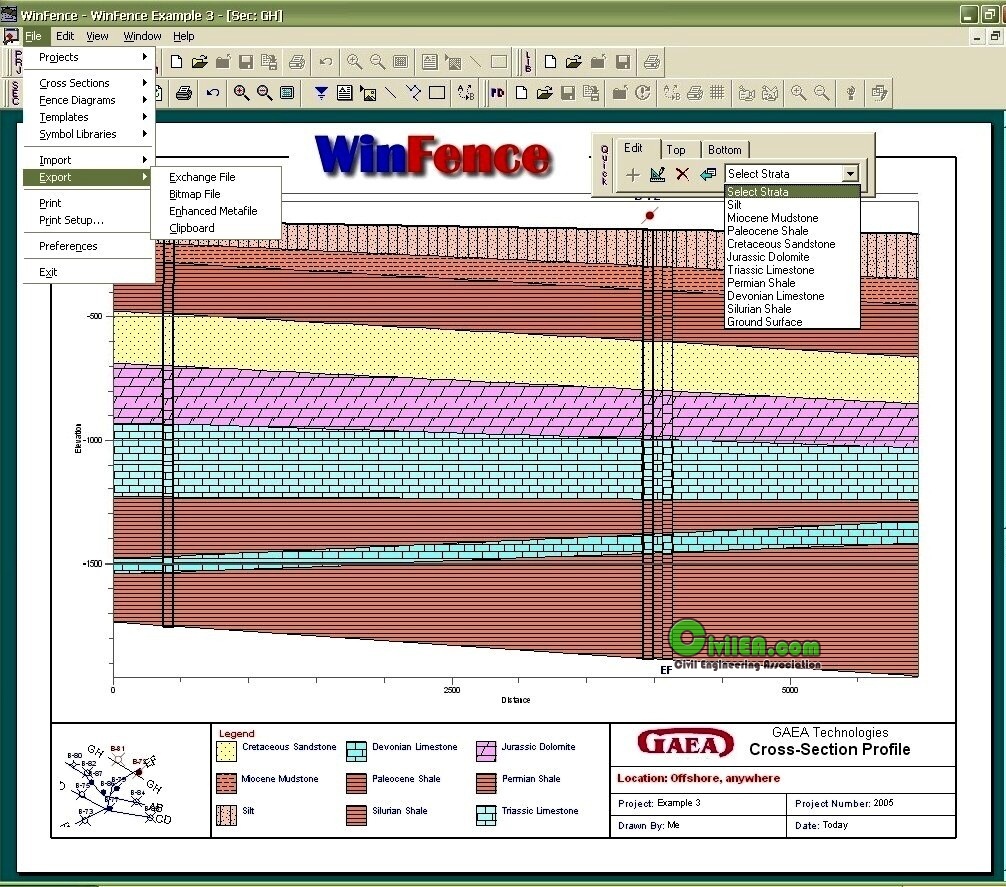
WinFence can be used to graphically create detailed, full-color, cross-sections and fence diagrams quickly and easily. The program can be used to interpret and map soil and rock layers, contamination, fossils, minerals and hydrocarbons. After the cross-section had been created it can be displayed in 3D along with other cross-sections in the project as a fence diagram. Fence diagrams are used to depict the geology and stratigraphy of the subsurface in 3 dimensions. Typically, fence diagrams show several cross-sections that may intersect as well as boreholes and wells. The 3D fence diagram display can be panned, zoomed, and rotated. The position of the user and the light source can also be easily moved.
A wide variety of strata can be used to create cross-sections. Types of strata that can be used include layers, faults, lenses, intrusions, and alteration zones (mineralization, contamination, hydrocarbons). Very detailed and complicated stratigraphy can be represented and easily drawn. Layers can contain multiple segments to represent uncomformities and highly faulted zones.
A unique snapping approach can be used to add layer, alteration zone, intrusion, and lense boundaries. This approach allows the boundary of one strata to be fixed to the boundary of another strata. Making the input of strata boundaries quick and accurate. Boundaries can be partially drawn and partially snapped. Snapped boundaries can include one or more different strata. In addition to snapping, strata boundaries can be assigned to the strata above or below.
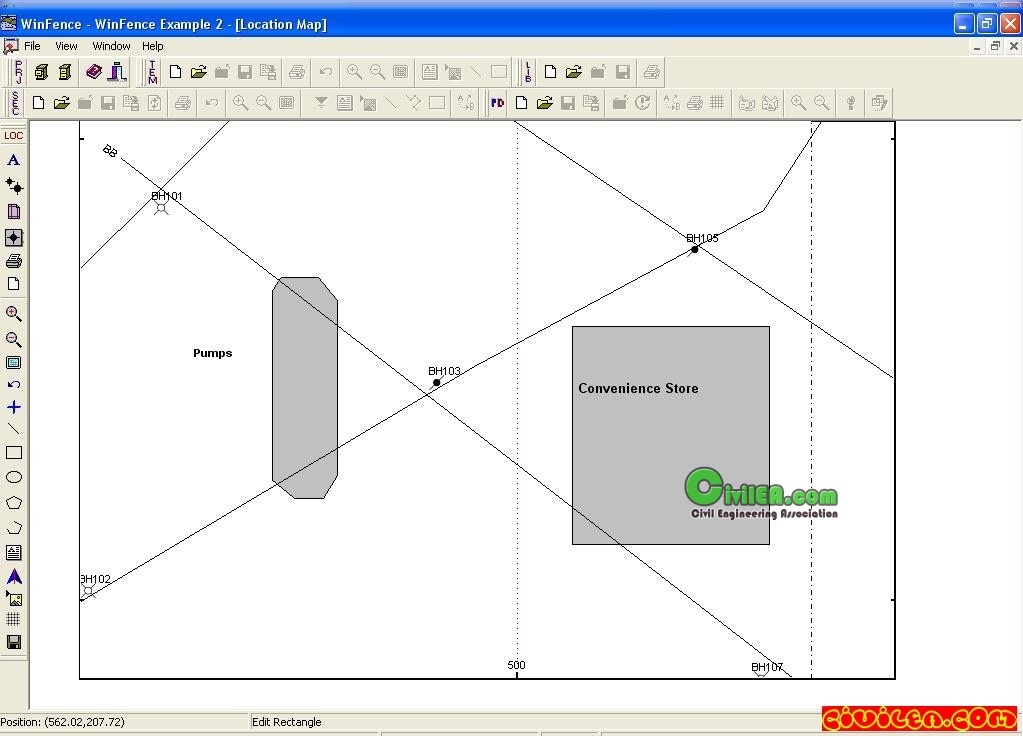
Projects are displayed using a geographical information system (GIS). The GIS displays a project location map that can be used to display and edit boreholes and cross-sections. In addition, site features and AutoCAD files can also be displayed. The project location map can also be printed to be included with the cross-sections and fence diagrams.
The format of the cross-section is controlled by a template, that can be easily edited and customized. Templates are used to specify the format and position of the cross-section, title bar, legend block, location map, and scale bar. Company logos, bitmaps, text paragraphs, lines, arrows, and rectangles can also be added to templates. Once the template is created it is available to all projects. WinFence comes with several previously created templates, that can be further customized.
WinFence shares the same database as WinLoG, and can be used to access and plot the borehole data entered in WinLoG. Several types of borehole data can be plotted on the cross-sections; including lithologic symbols, sample symbols, core logs, well diagrams, graphs, and geophysical logs. The actual borehole log data can be opened and edited in WinLoG by double-clicking on the borehole in WinFence. WinFence works in conjunction with WinLoG to ensure a seamless exchange of data.
All cross-section data for a project is stored in a Microsoft Access database. This database allows for the quick storage and retrieval of cross-section data and can be interfaced with a variety of other programs. There is no limit to the number of projects and cross-sections that can be stored in the database. The database is setup to work across a network if desired, with each project stored in a separate directory.
Features:
- Strata in cross-sections can be automatically generated by the programs built-in intelligence.
- Fence diagrams can be generated, displayed and printed in 3D.
- Position of the user and light source can be dynamically moved in the 3D fence diagram.
- When creating the fence diagram, you can use all of the cross-sections or specify which ones to use.
- Templates are used to format the fence diagram. The template can be the same as the cross-sections or one setup specifically for the fence diagram.
- Cameras are used to represent the user in 3D space and are used to view the fence diagram from various positions and angles. The positions of the cameras can be easily moved using the Scene Map. There can be one or more cameras in 3D space.
- Shading can be enabled on the fence diagram, by adding a light source. The position of the light source can be adjusted using the Scene Map.
- Graphical Information System (GIS) for displaying and picking boreholes and cross-sections in WinLoG with WinFence. GIS can also display site features and import AutoCAD files.
- Intersecting cross-sections can be displayed on a cross-section.
- Intersecting cross-sections can be used when automatically generating a new cross-sections.
- Deviated boreholes can be displayed on a cross-section.
- Multiple water levels can be drawn on the cross-section. The water level can be drawn automatically using the water levels stored in WinLoG.
- New Quick strata toolbar makes editing strata much easier and quicker.
- Strata from WinLoG project are automatically added to the program.
- Addition of new strata has been made simpler.
- The features (wells, grid, lines, etc.) shown on the location map can be turned on and off in the template.
- Poly-lines can be drawn any where on a cross-section.
- Program can automatically update itself to the most recent version.
- Program has online technical support, where it can email technical support all relevant files and information if there is a problem.
- All of the databases (Project, Project List, Main Database) are automatically backed up and can be easily restored.
- Projects and templates can have passwords assigned to control usage.
- Databases can be compressed and repaired.
OS: Windows ALL
Language: English
Manufactured by: GAEA Technologies Ltd
Current version: 3.0, with significant differences.
http://www.gaeatech.com/en-us/winfence_2.html
http://www.gemsoft.us/WinFence.htm
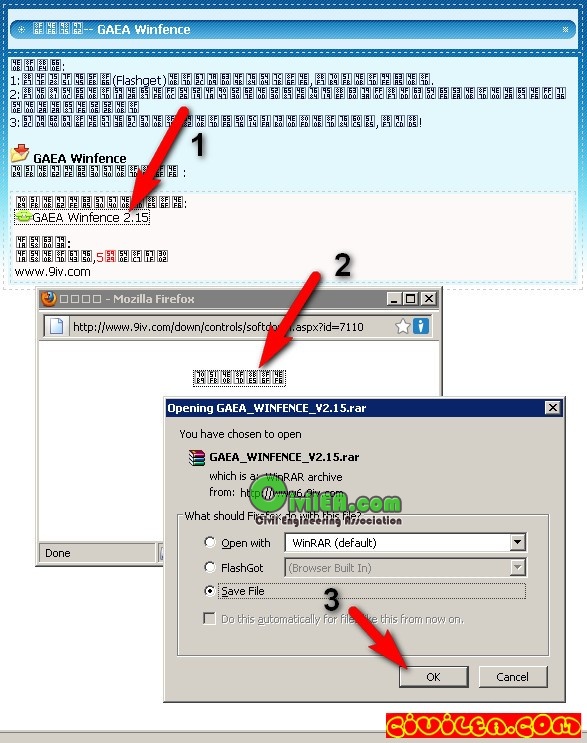
http://www.mediafire.com/?o5fvus64x78nnu2
Password;
www.CiviLEA.com-201142


 پاسخ با نقل قول


علاقه مندی ها (Bookmarks)